

GateUser-6c14d734
Skilled in medium to long term and short-term trading, with irregular daily updates. Follow the WeChat official account for copy trading: Crypto World Zhang Zhengwei.
GateUser-6c14d734
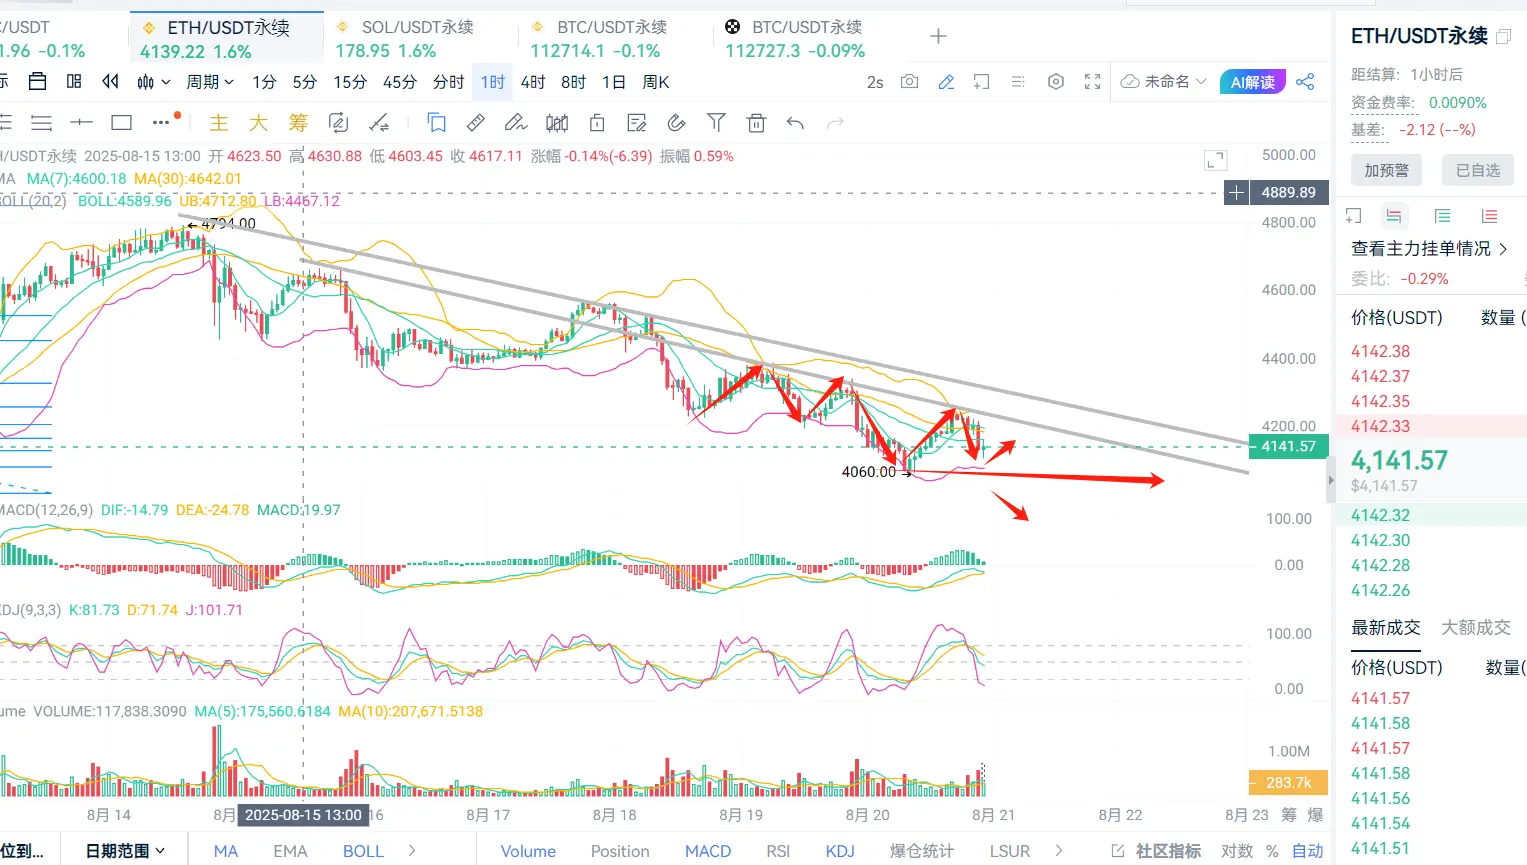
8.20 Ether Market Analysis
Ether intraday rose to hit the downward trend line pressure and retreated, currently breaking the intraday Fibonacci. The one-hour Bollinger Bands downward channel has reopened, with the upper band suppressing the ma moving average, breaking the middle band again. Short-term support to watch is at 4065; if touched and not broken, maintain a neutral position. The MACD in the amplitude chart shows a golden cross with reduced volume, and the technical KDJ has ample downward space. Overall, the bearish trend is clear at the moment, and it is recommended to follow the tre
View OriginalEther intraday rose to hit the downward trend line pressure and retreated, currently breaking the intraday Fibonacci. The one-hour Bollinger Bands downward channel has reopened, with the upper band suppressing the ma moving average, breaking the middle band again. Short-term support to watch is at 4065; if touched and not broken, maintain a neutral position. The MACD in the amplitude chart shows a golden cross with reduced volume, and the technical KDJ has ample downward space. Overall, the bearish trend is clear at the moment, and it is recommended to follow the tre
- Reward
- like
- Comment
- Repost
- Share
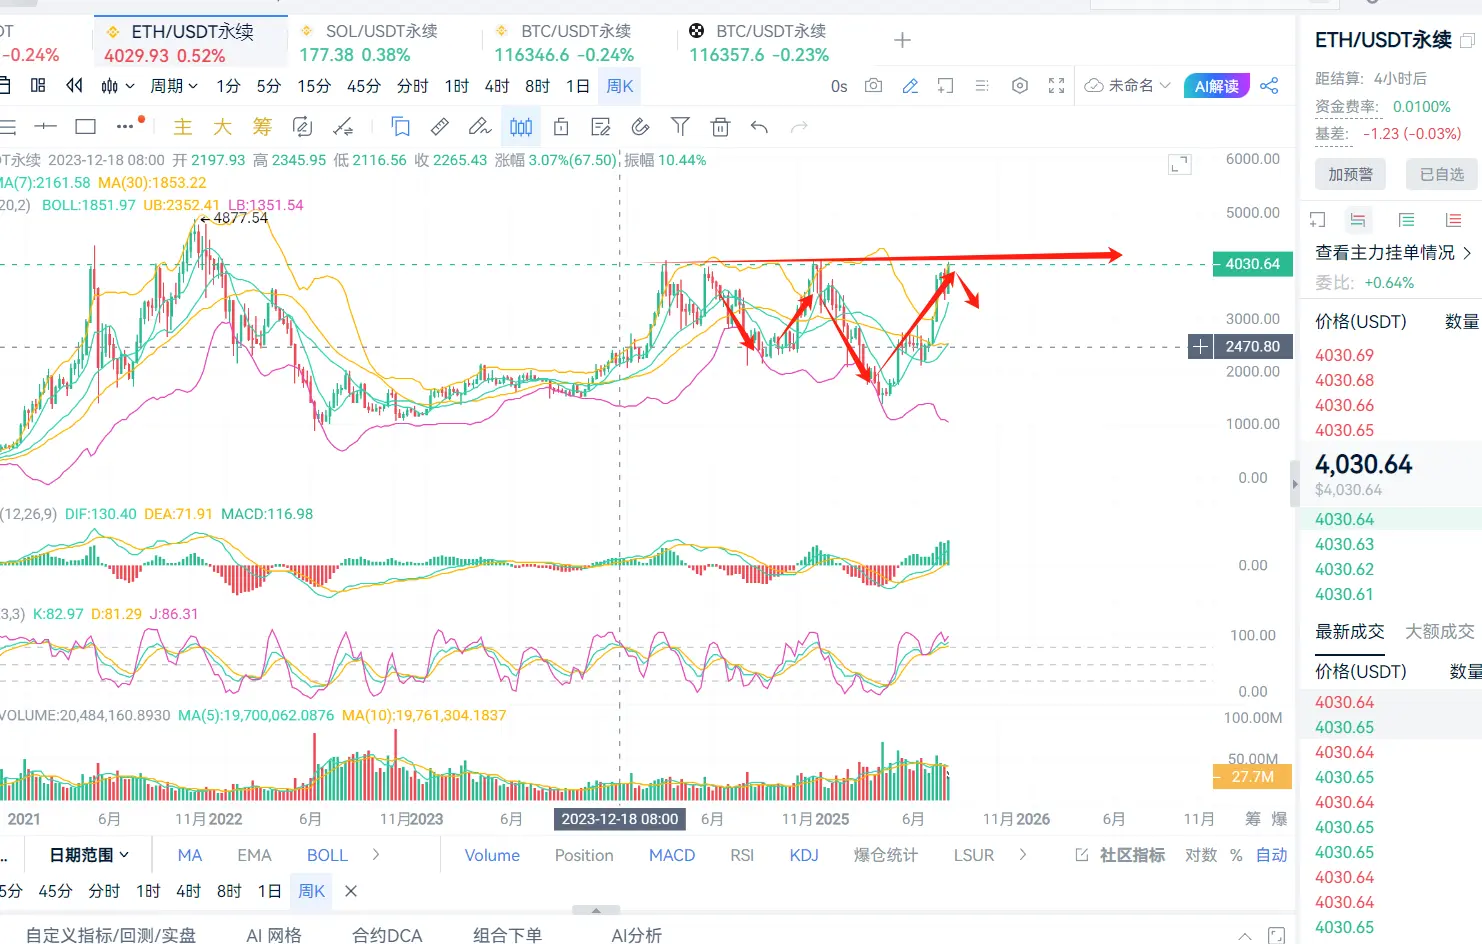
8.19 Ether strategy suggestions
Ether has continued to decline after reaching a historical high, exhibiting a stepwise downward trend. From the four-hour level perspective, the MA moving average has crossed below the middle track, indicating a bearish signal. The Bollinger Bands have narrowed and show signs of consolidation, with the pullback trend line at 4400 acting as an intraday resistance point. A drop below 4160 warrants attention on the significant level of 4000. The MACD on the chart has broken below the 0-axis support, and the death cross with reduced volume suggests short-term reboun
View OriginalEther has continued to decline after reaching a historical high, exhibiting a stepwise downward trend. From the four-hour level perspective, the MA moving average has crossed below the middle track, indicating a bearish signal. The Bollinger Bands have narrowed and show signs of consolidation, with the pullback trend line at 4400 acting as an intraday resistance point. A drop below 4160 warrants attention on the significant level of 4000. The MACD on the chart has broken below the 0-axis support, and the death cross with reduced volume suggests short-term reboun
- Reward
- like
- Comment
- Repost
- Share
8.15 Ether Market Analysis
In the morning, Ether fell to 4450 and rebounded. It is now close to the Fibonacci resistance, and the one-hour MA has broken the middle track. There are ample opportunities for Ether to gain momentum. The Bollinger Bands show a trend of convergence between the upper and lower bands, indicating that this rise is nearing its end, and Ether has no volume to hit new highs this week. The MACD has formed a golden cross and is rising, with Ether having a little room for upward fluctuation. Technically, the KDJ fast line has reached the top, and the main force has arrived a
View OriginalIn the morning, Ether fell to 4450 and rebounded. It is now close to the Fibonacci resistance, and the one-hour MA has broken the middle track. There are ample opportunities for Ether to gain momentum. The Bollinger Bands show a trend of convergence between the upper and lower bands, indicating that this rise is nearing its end, and Ether has no volume to hit new highs this week. The MACD has formed a golden cross and is rising, with Ether having a little room for upward fluctuation. Technically, the KDJ fast line has reached the top, and the main force has arrived a
- Reward
- like
- Comment
- Repost
- Share
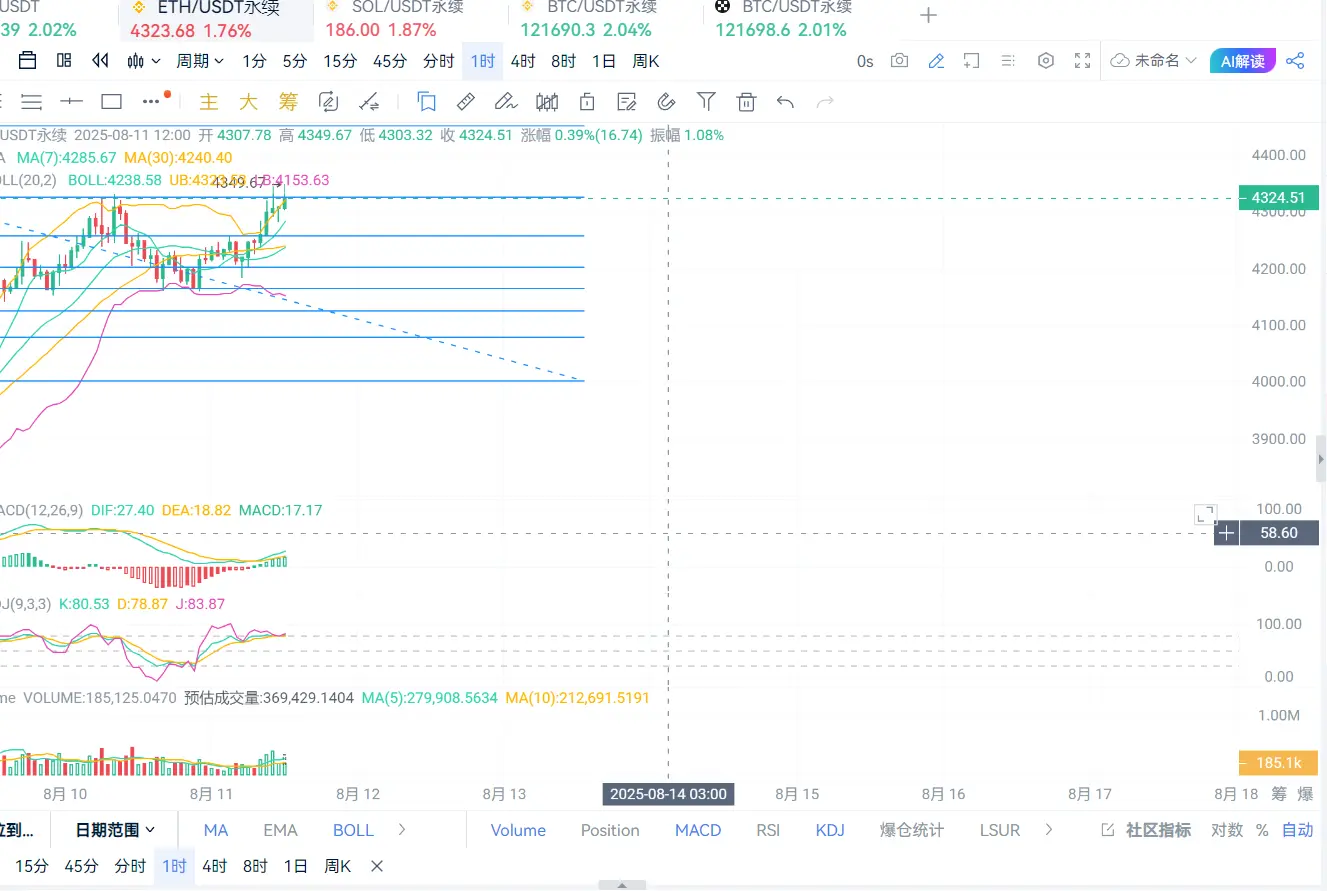
8.11 Ether Market Analysis
Ether surged yesterday, breaking through the weekly K resistance level, and is currently stabilizing around the 4300 line. During the early session today, it broke above yesterday's high, and this week's weekly K opening will continue to rise, with spot prices possibly reaching the 5000 line. The one-hour level has entered an overbought market, and the MA moving averages have formed a golden cross again, with the MACD slow line supported by the 0 axis forming a golden cross with increased volume. Overall, Ether looks bullish for the day.
Operational advice: Buy in ba
View OriginalEther surged yesterday, breaking through the weekly K resistance level, and is currently stabilizing around the 4300 line. During the early session today, it broke above yesterday's high, and this week's weekly K opening will continue to rise, with spot prices possibly reaching the 5000 line. The one-hour level has entered an overbought market, and the MA moving averages have formed a golden cross again, with the MACD slow line supported by the 0 axis forming a golden cross with increased volume. Overall, Ether looks bullish for the day.
Operational advice: Buy in ba
- Reward
- 1
- 1
- Repost
- Share
LuckAndFortuneComeTo :
:
Excellent, excellent, thank you for your daily sharing.8.9 Ether Market Analysis
Ether rose to 4070 in the early morning, reaching the top resistance of the weekly K3 before falling back. Currently, it is fluctuating at a high level, attempting to stabilize around the 4000 mark. The Bollinger Bands on the hourly level are about to narrow and become parallel, with the 7-week MA line suppressing the bare K. This week, pay attention to the strong pressure around the 4100 line; if it does not break, multiple short positions can be established. The MACD indicator shows a continuous increase in the red energy bars. Overall, it is advised to wait for reb
View OriginalEther rose to 4070 in the early morning, reaching the top resistance of the weekly K3 before falling back. Currently, it is fluctuating at a high level, attempting to stabilize around the 4000 mark. The Bollinger Bands on the hourly level are about to narrow and become parallel, with the 7-week MA line suppressing the bare K. This week, pay attention to the strong pressure around the 4100 line; if it does not break, multiple short positions can be established. The MACD indicator shows a continuous increase in the red energy bars. Overall, it is advised to wait for reb
- Reward
- like
- Comment
- Repost
- Share
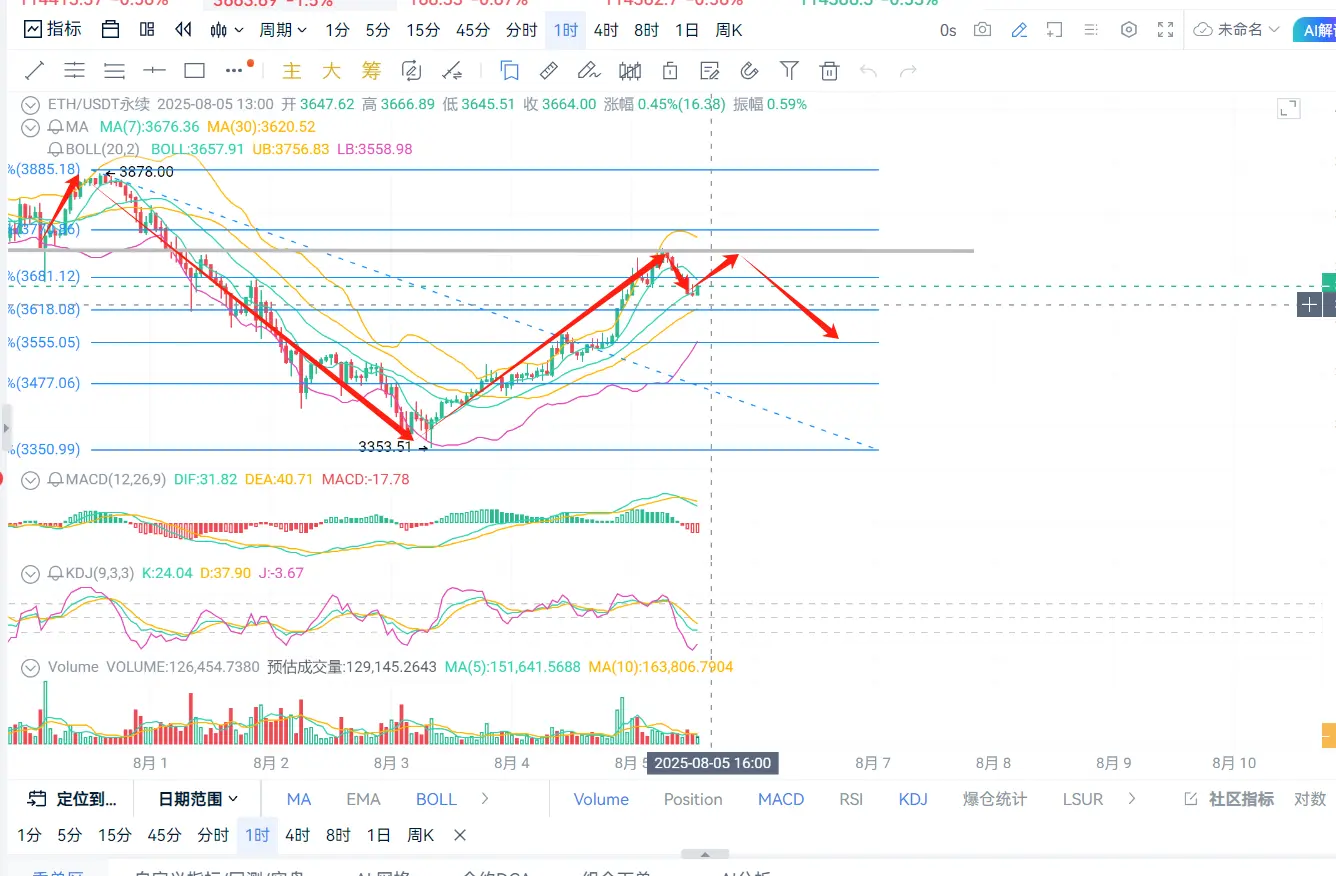
8.5 Ether Market Analysis
Ether rose in the morning, breaking the 3700 level but failed to stabilize, and has now fallen back to around 3660. The Bollinger Bands on the hourly chart are about to tighten, with last month's closing at 3750 confirming the pressure for this week. The MA moving averages have completed one wave of upward movement, and the subsequent bullish momentum is weak, suggesting a bearish outlook. The MACD in the auxiliary chart shows a dead cross gradually expanding, while the KDJ on the technical side is at the mid-point, indicating that the short-term Ether market will mai
View OriginalEther rose in the morning, breaking the 3700 level but failed to stabilize, and has now fallen back to around 3660. The Bollinger Bands on the hourly chart are about to tighten, with last month's closing at 3750 confirming the pressure for this week. The MA moving averages have completed one wave of upward movement, and the subsequent bullish momentum is weak, suggesting a bearish outlook. The MACD in the auxiliary chart shows a dead cross gradually expanding, while the KDJ on the technical side is at the mid-point, indicating that the short-term Ether market will mai
- Reward
- like
- Comment
- Repost
- Share
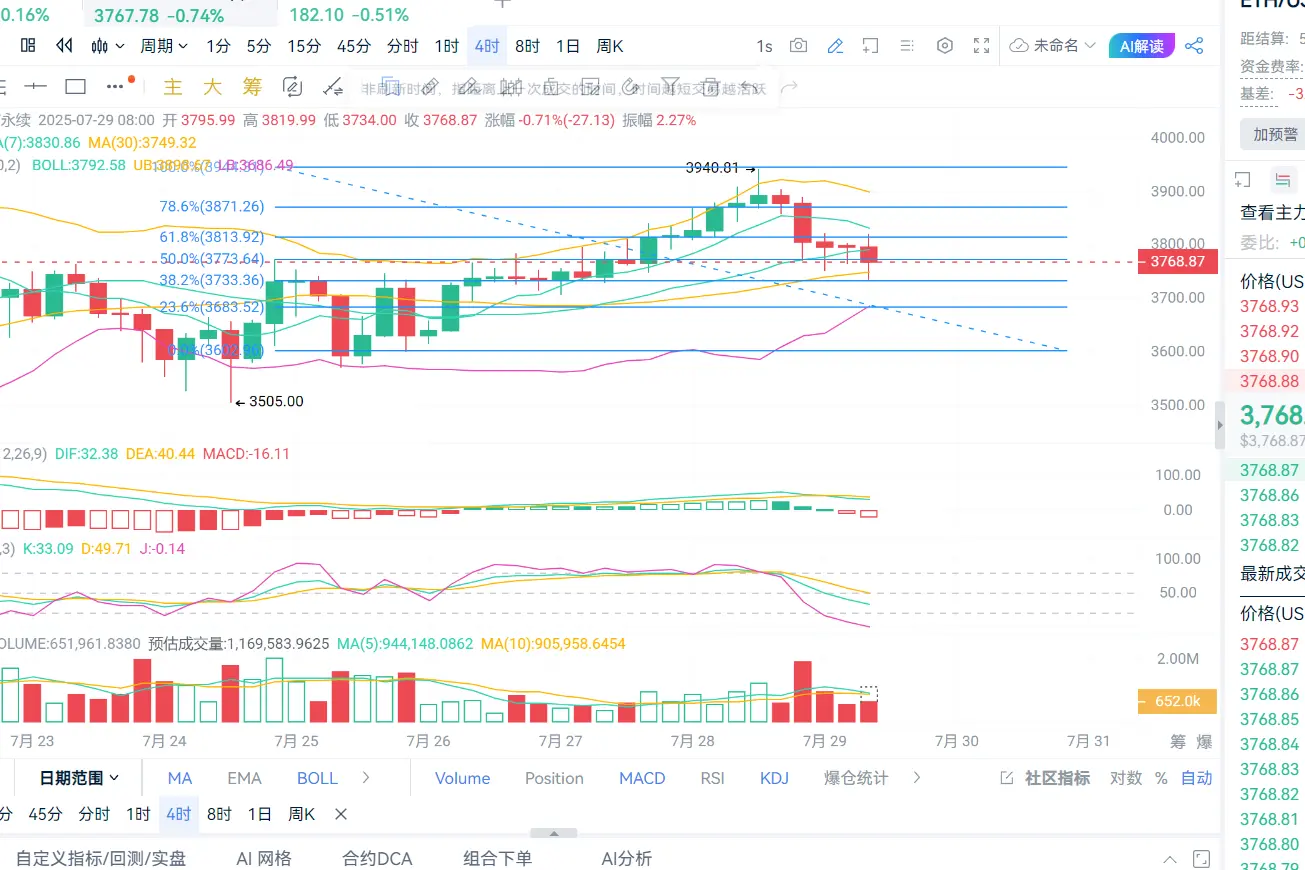
7.29 Ether market analysis
Ether surged yesterday and was about to touch the 4000 mark before falling back. It broke below the Fibonacci support line in the morning, and the one-hour MA line has crossed below the middle band. This week, the bulls have no strength to break through the 4000 level. Short-term pressure to watch is at 3780, and support on the way down is at 3680. The MACD on the broader chart has broken below the 0 axis. Overall, Ether has ample downward space, and it is recommended to follow the trend.
Operation suggestion: short in batches at 3780-3800
Target: 3705
Risk Control:
View OriginalEther surged yesterday and was about to touch the 4000 mark before falling back. It broke below the Fibonacci support line in the morning, and the one-hour MA line has crossed below the middle band. This week, the bulls have no strength to break through the 4000 level. Short-term pressure to watch is at 3780, and support on the way down is at 3680. The MACD on the broader chart has broken below the 0 axis. Overall, Ether has ample downward space, and it is recommended to follow the trend.
Operation suggestion: short in batches at 3780-3800
Target: 3705
Risk Control:
- Reward
- like
- Comment
- Repost
- Share
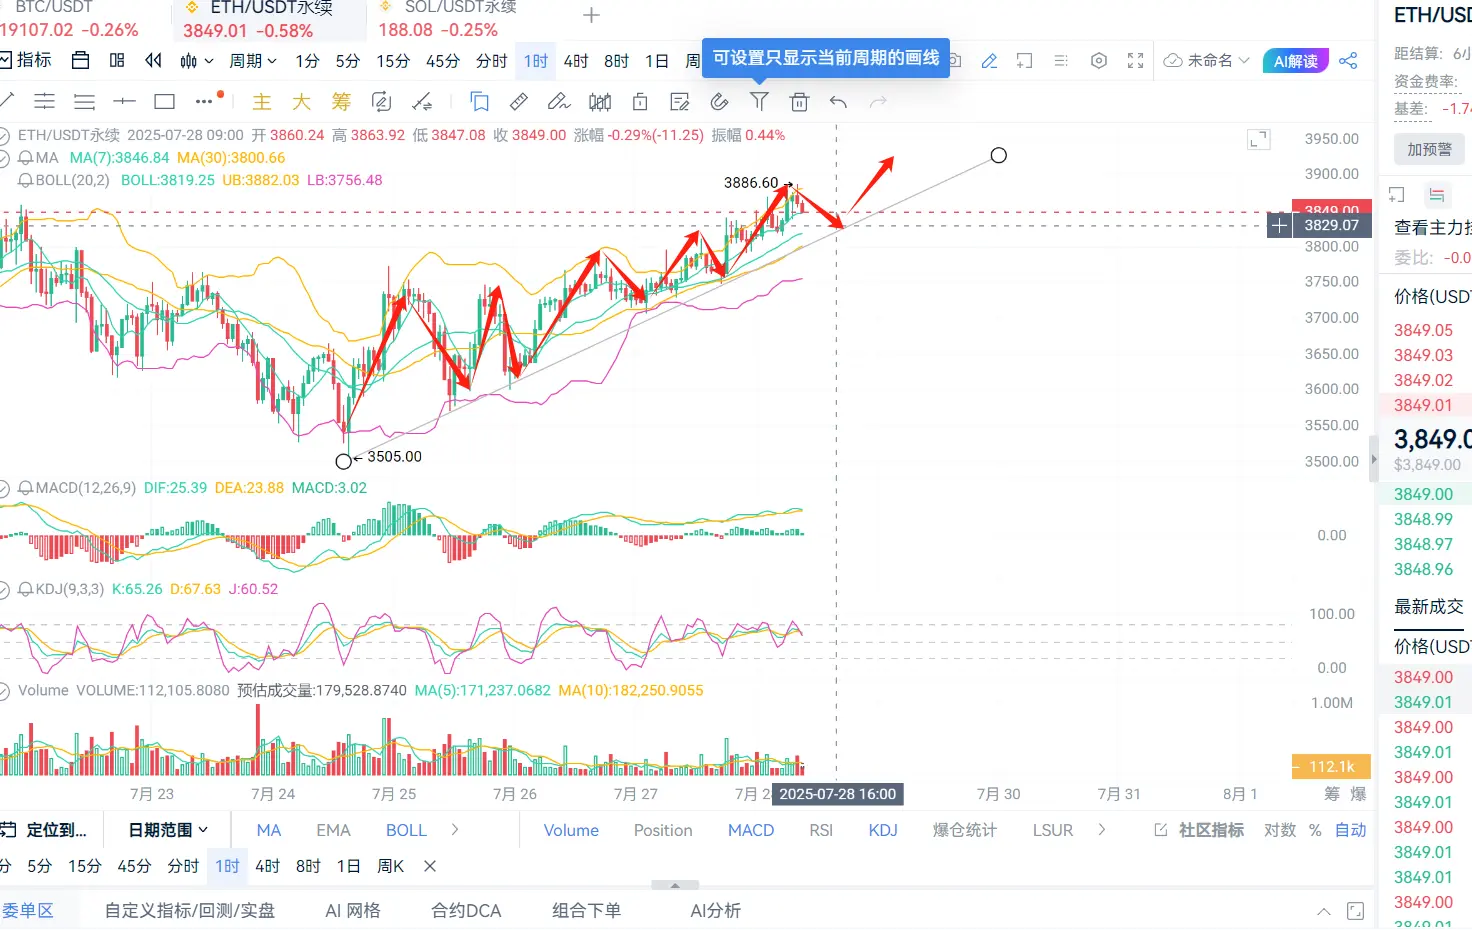
7.28 Ether market analysis
Ether has broken a new high of 2886 today, currently oscillating around the 3850 level. The one-hour naked K chart is supported by the 7-week moving average. The Bollinger Bands are opening upward, maintaining an upward trend, with resistance at the 4000 level. If a double top pullback occurs, watch for 4100; unless strong resistance is touched, Ether will not experience a significant plunge. On the daily level, Ether has re-entered the overbought zone, indicating that the bullish momentum for Ether is sufficient, and the main force still maintains confidence in brea
Ether has broken a new high of 2886 today, currently oscillating around the 3850 level. The one-hour naked K chart is supported by the 7-week moving average. The Bollinger Bands are opening upward, maintaining an upward trend, with resistance at the 4000 level. If a double top pullback occurs, watch for 4100; unless strong resistance is touched, Ether will not experience a significant plunge. On the daily level, Ether has re-entered the overbought zone, indicating that the bullish momentum for Ether is sufficient, and the main force still maintains confidence in brea
ETH5.05%
- Reward
- like
- Comment
- Repost
- Share
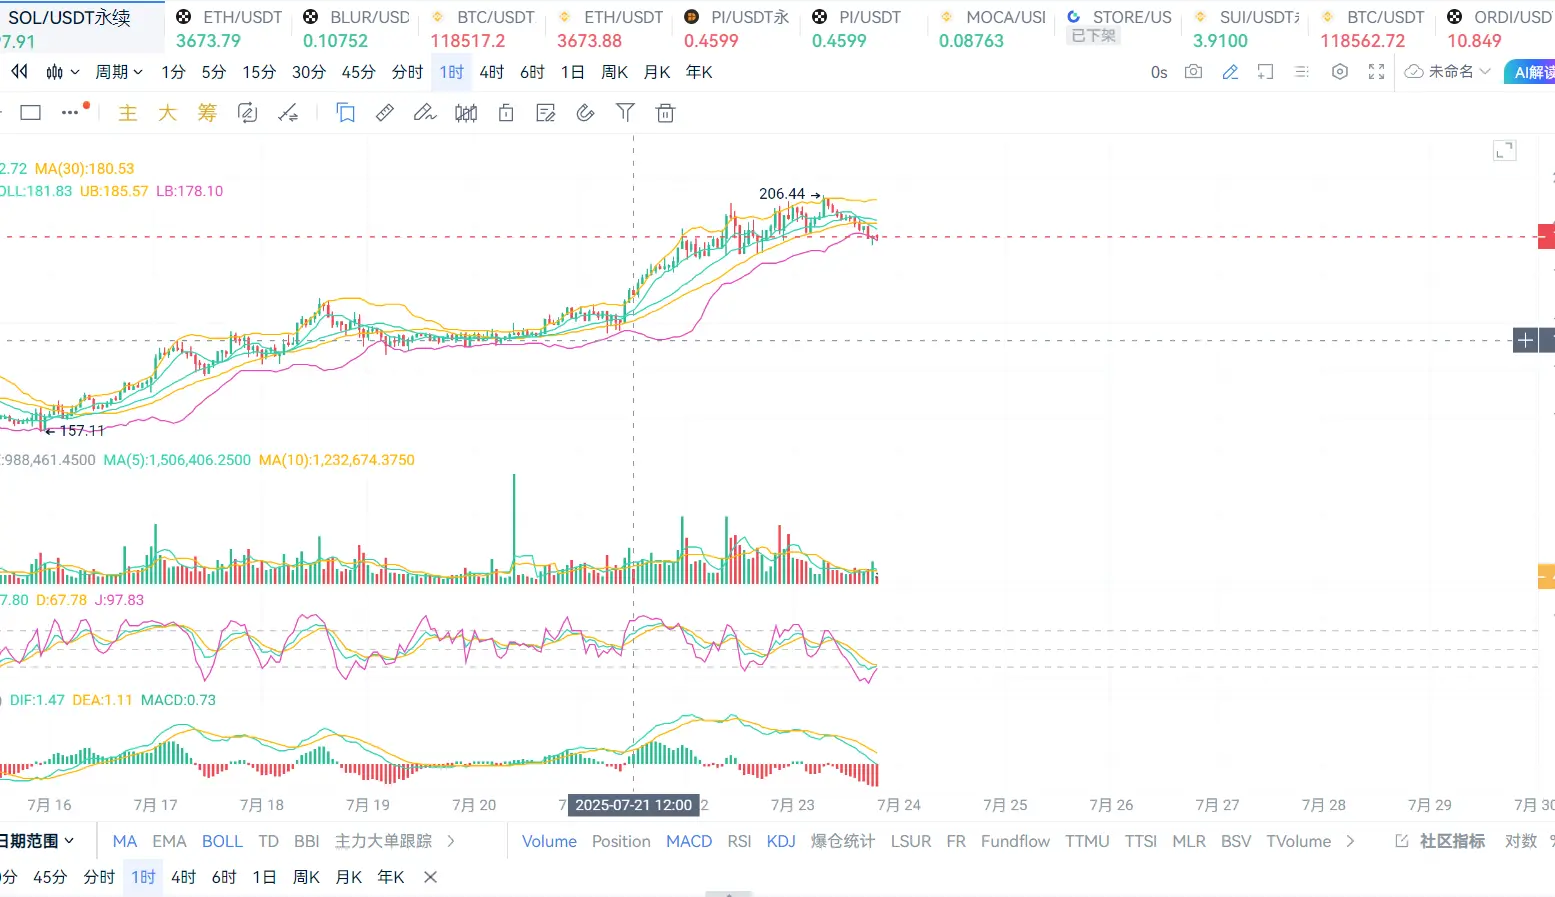
7.23sol Market Analysis
The price of SOL has broken through the 200 level with strong bullish volume during the day, and the one-hour MA30 is maintaining a golden cycle. The Bollinger Bands have contracted at a high level, providing room for a pullback. Watch for support at 193; if reached, long-term long positions can be considered. Overall, SOL still has upside potential in the long term. It is recommended to wait for the support level to enter long positions.
Operation suggestion: buy in batches at 193-190
Target: 205-210-215
Risk Control: 187
SOL4.71%
- Reward
- like
- Comment
- Repost
- Share
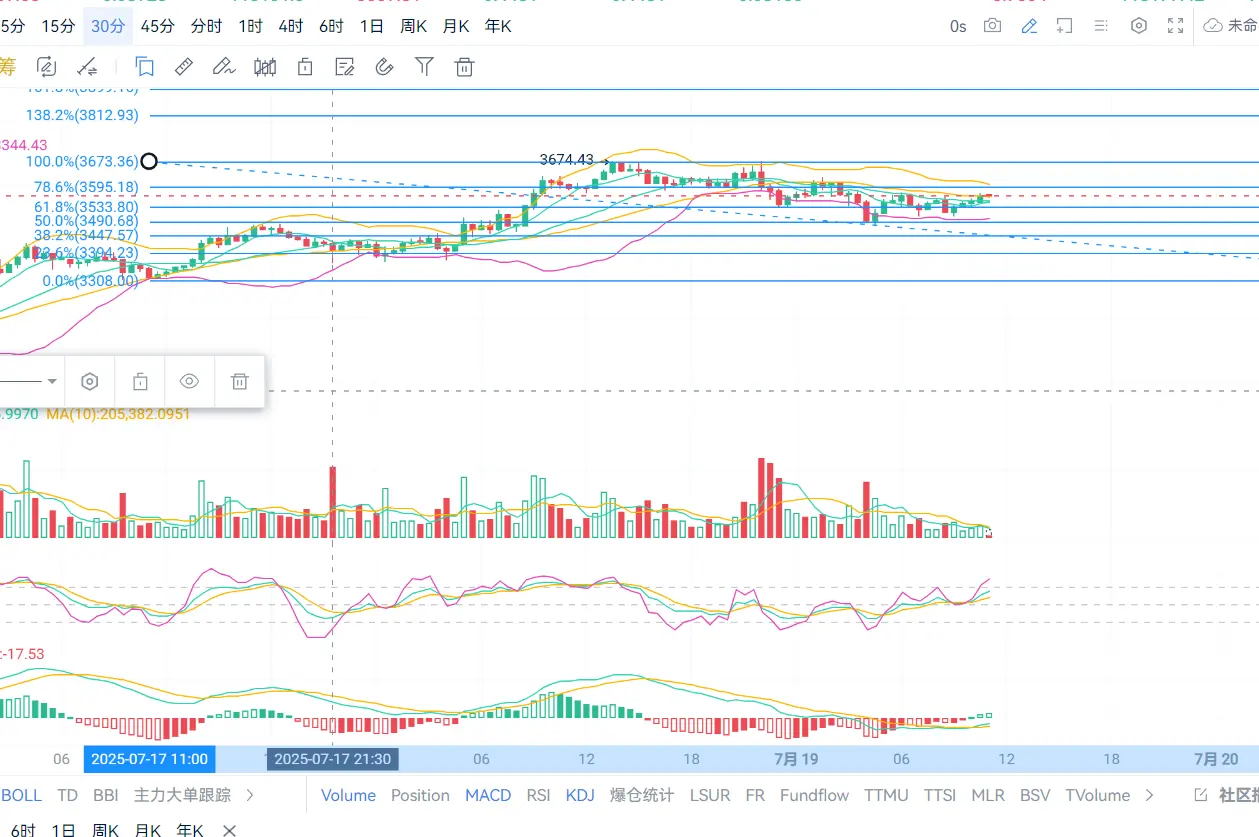
7.19 Ether Market Analysis
On an hourly basis, Ether rose 3675 yesterday and then retraced, rebounding this morning after touching the Fibonacci level of 3490, indicating that this support is effective. The 30-week moving average is converging with the middle band, and the Bollinger Bands on the daily chart are opening parallel and fluctuating. The main trend will remain a fluctuating upward movement for the next two days. Overall, Ether can maintain a bullish outlook.
Operation suggestion: Buy in batches at 3560-3530
Target: 3620-3680
Risk Control:3510
View OriginalOn an hourly basis, Ether rose 3675 yesterday and then retraced, rebounding this morning after touching the Fibonacci level of 3490, indicating that this support is effective. The 30-week moving average is converging with the middle band, and the Bollinger Bands on the daily chart are opening parallel and fluctuating. The main trend will remain a fluctuating upward movement for the next two days. Overall, Ether can maintain a bullish outlook.
Operation suggestion: Buy in batches at 3560-3530
Target: 3620-3680
Risk Control:3510
- Reward
- like
- 1
- Repost
- Share
Ak007trader:
Crypto isn’t just about profit… It’s about power, freedom, and the future of finance." Learn before you trade.
Stay sharp. Stay secure.
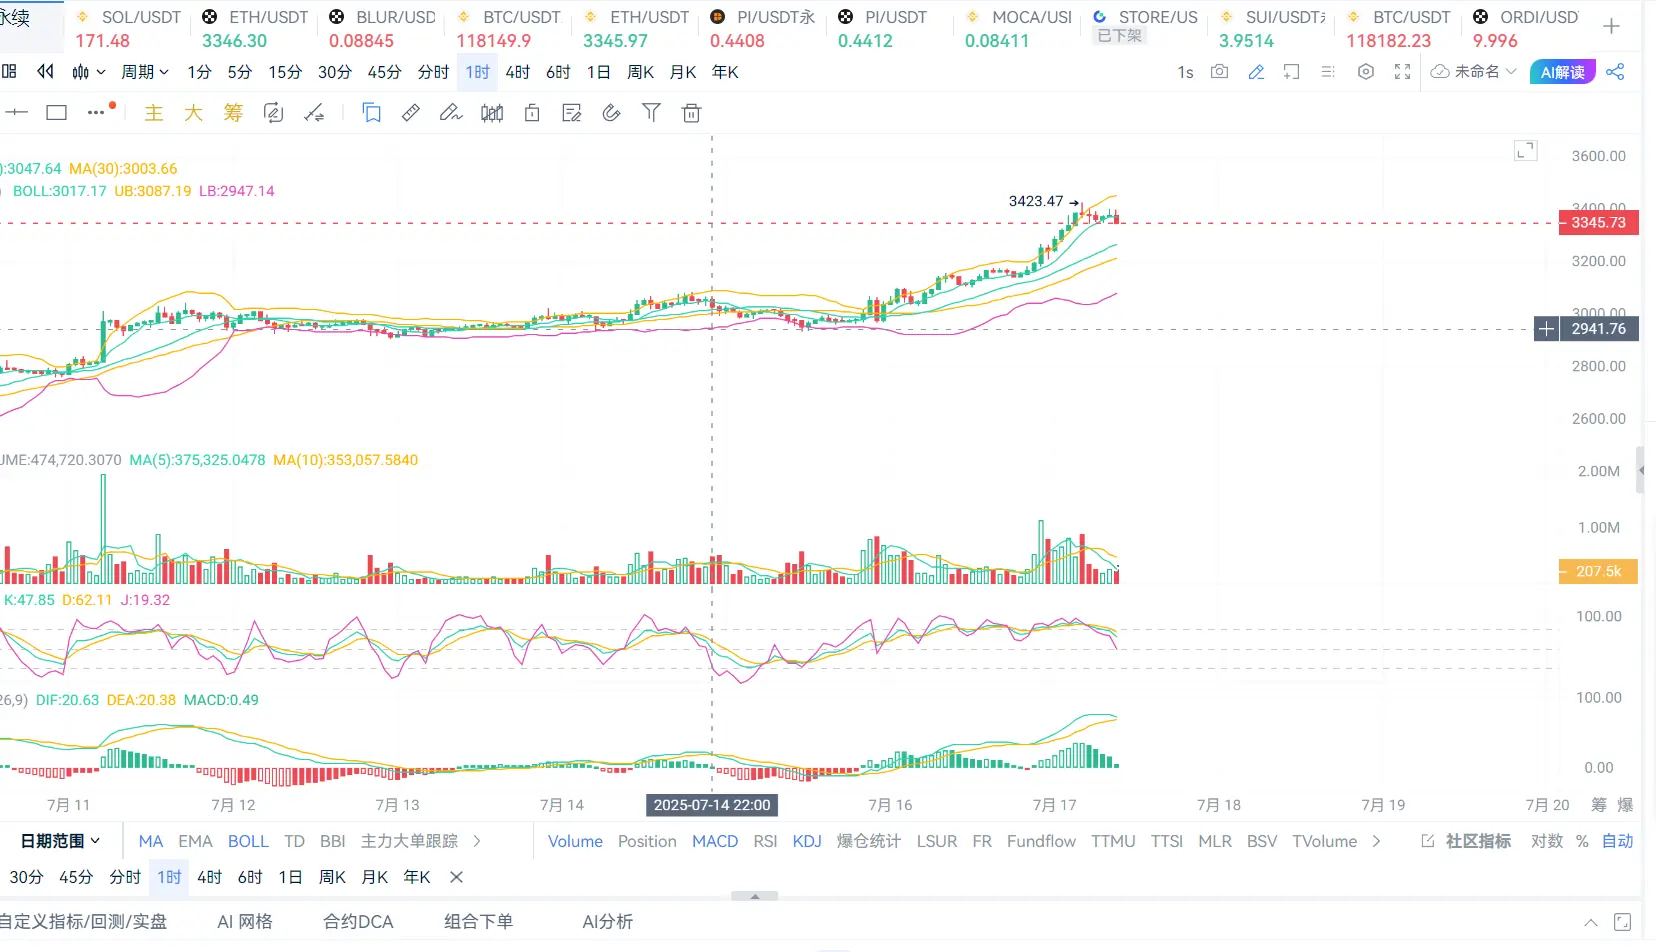
7.17 Ether Thinking Suggestions
Ether has once again rebounded today, reaching around 3430, close to 3450, but faced resistance and retreated. This rise has hit the daily resistance level, and the bullish momentum for the day has been exhausted. The one-hour ma7 weekly moving average has turned downward, providing ample room for a pullback. After the Bollinger Bands have narrowed, a retest is coming. The MACD in the auxiliary chart is about to reduce volume after a golden cross, and the fast and slow lines are showing a top divergence as it continues to fall. Overall, Ether can be positioned f
View OriginalEther has once again rebounded today, reaching around 3430, close to 3450, but faced resistance and retreated. This rise has hit the daily resistance level, and the bullish momentum for the day has been exhausted. The one-hour ma7 weekly moving average has turned downward, providing ample room for a pullback. After the Bollinger Bands have narrowed, a retest is coming. The MACD in the auxiliary chart is about to reduce volume after a golden cross, and the fast and slow lines are showing a top divergence as it continues to fall. Overall, Ether can be positioned f
- Reward
- 2
- Comment
- Repost
- Share
7.16 Ether market analysis
Ether rebounded in the morning, reaching a new high of 3150, with a significant volume surge at the one-hour level. The MA moving average formed a golden cross at 4 AM. In the short term, Ether has room for a pullback, with support to watch at 3080, where one can consider placing long positions. The four-hour naked K-line broke through the upper band and closed, indicating a strong bullish trend within the day. Lao Zhang strongly suggests a predominantly bullish outlook.
Operational suggestion: Buy in batches at 3085-3050
Target: 3150-3240
Risk Control:3030
View OriginalEther rebounded in the morning, reaching a new high of 3150, with a significant volume surge at the one-hour level. The MA moving average formed a golden cross at 4 AM. In the short term, Ether has room for a pullback, with support to watch at 3080, where one can consider placing long positions. The four-hour naked K-line broke through the upper band and closed, indicating a strong bullish trend within the day. Lao Zhang strongly suggests a predominantly bullish outlook.
Operational suggestion: Buy in batches at 3085-3050
Target: 3150-3240
Risk Control:3030

- Reward
- like
- Comment
- Repost
- Share
7.14 BTC Market Analysis
BTC opened on the weekly chart and broke through the 120,000 mark, currently trying to stabilize. On the hourly chart, after a spike, it still maintains bullish momentum and has not yet given a signal of peaking. The first resistance level for BTC is around 124,000, which is likely to face pressure upon touching. The short-term support to watch is 120,500, which has just been reached. The MACD indicator still shows a golden cross with volume available. Overall, BTC's bulls still have momentum, and it is recommended to follow the trend.
Operation suggestion: Current pri
BTC0.77%

- Reward
- like
- Comment
- Repost
- Share